
Every organization has processes, and every process ultimately has inefficiencies of some kind.
Evaluating those processes — through workflow process mapping (otherwise known as Business Process Model and Notation, or BPMN) — is essential to figuring out those inefficiencies and ensuring that an organization is operating at peak performance. This, in itself, is a crucial component of effective Business Process Management (BPM).
Workflow mapping is designed to determine where to focus improvement efforts. Invented in 1921 by Frank Gilbreth for the American Society of Mechanical Engineers (ASME), the process flow charts methodology has been helping project managers map out their business processes for a century now and shows no sign of dipping in popularity.
Yet it’s not always the quickest or easiest task to undertake for any organization. It involves a lot of mapping (as the name suggests), as well as time, consideration and planning. It’s also often a team activity.
While the process isn’t always easy, it is essential. The good news is that there are ways to ensure that your workflow process mapping goes smoothly and gives you the results you want. Process mapping is a key tool for process improvement. Once you make a habit of process mapping by documenting your existing or new processes, you’ll be able to better assess where to focus your energies and enter a pattern of continuous improvement of your business processes.
Here are a few tips for getting the most out of your mapping process.
1. Don’t Map Every Single Process
Process mapping shouldn’t be a buzzword.
You should do it because you want to learn about and improve the various workflows that make up your organization.
The key is in understanding that not every process needs to be mapped.
Primarily, you want to look at areas of your organization that are underperforming, whether that means noticeably failing to meet goals or simply not living up to desired expectations.
Look for processes and departments that have obvious bottlenecks first. From there, you will most likely see how those processes are impacting other areas of your organization.
Here’s an example of a simplified (but effective) process map:
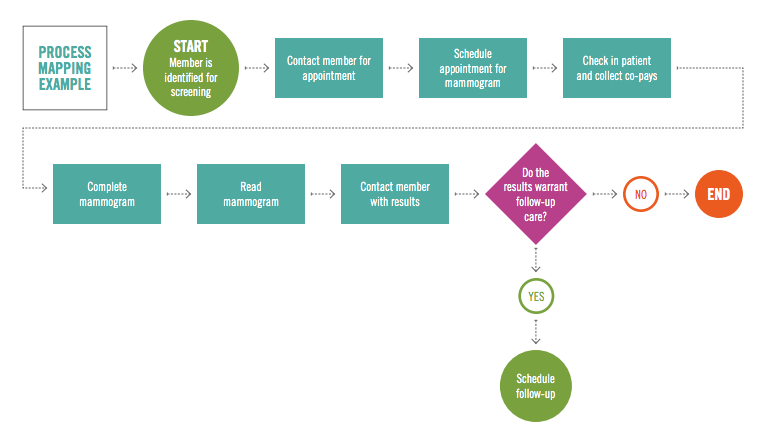
To start the mapping process, consider your objectives. The goal is to:
- Identify persons who are executing each process
- Determine which events occur at every step in the process
- Detail each step clearly and visually (mapping)
- Search for bottlenecks or other slow-downs
- Analyze data to find areas of improvement
- Create an actionable plan for improvement
There are certain processes that will be clearer than others.
If you’re not sure whether there are bottlenecks but you’re noticing that something is “off,” start there.
2. Ask: What Type of Process is This and Can It Be Mapped?
It’s also important to know that process mapping doesn’t work on every single process.
Most organizations’ business operation can be categorized into three types of processes:
- Transformational (manufacturing processes, input/output, etc.)
- Transactional (sales activities, call center support, outcome-focused, etc.)
- Decision-making (approved/rejected applications, pricing, inventory control, etc.)
Different types of process maps are more effective than others depending on the type of process:
- A Basic Flow Chart is a great starting point for new projects; to analyze and manage workflows; to solve problems; and to model processes
- A Cross-Functional Flowchart (otherwise known as a deployment flow chart or swim-lane chart) is useful for identifying the relationships between the key roles in a process and how processes flow between different departments and stakeholders, as well as identifying potential redundancies or bottlenecks in a process
- A SIPOC diagram shows the key elements of a process: the Suppliers, Inputs, Process, Outputs, and Customers, and their interrelationships. This can be very useful for better understanding the key elements of a process to be considered before creating a more detailed map.
- A Value Stream Map visualizes the flow of material and/or information required to bring your product to a customer, which can be helpful for documenting and improving flows, identifying waste and giving focus to Value Stream Mapping is also helpful for analyzing the current state of your processes according to definable metrics .
A process map for a manufacturing process will most likely be easier to create than a process map for inventory control.
Here’s an example of a typical sales workflow, for instance:
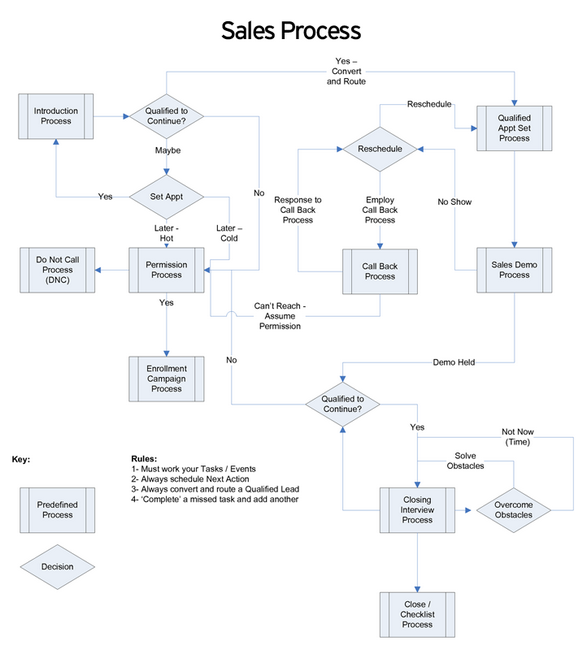
There is an obvious flow to every process step, which can be mapped by symbols and arrows – diamonds for decision points, rectangles for activities and operations, and so on. Not every process, however, can be visualized so neatly.
Consider whether or not the process involves a lot of high-level, open-ended decisions.
This will require more than just a flowchart to map, so consider starting with your more basic transformational or transactional processes.
Those can typically be mapped using something as simple as a swimlane diagram.
3. Start with a Simple Design and Virtualize It Later
The initial mapping process will be messy. You will most likely add or removes steps, change the way your map looks, assign/re-assign names and change colors.
So there’s no reason why you need to start with an expensive or complex mapping tool. You could use Microsoft Office’s built-in flowchart templates, but really…
A roll of paper and some sticky notes is really all you need to start. Click To TweetHere’s an example of what that might look like:
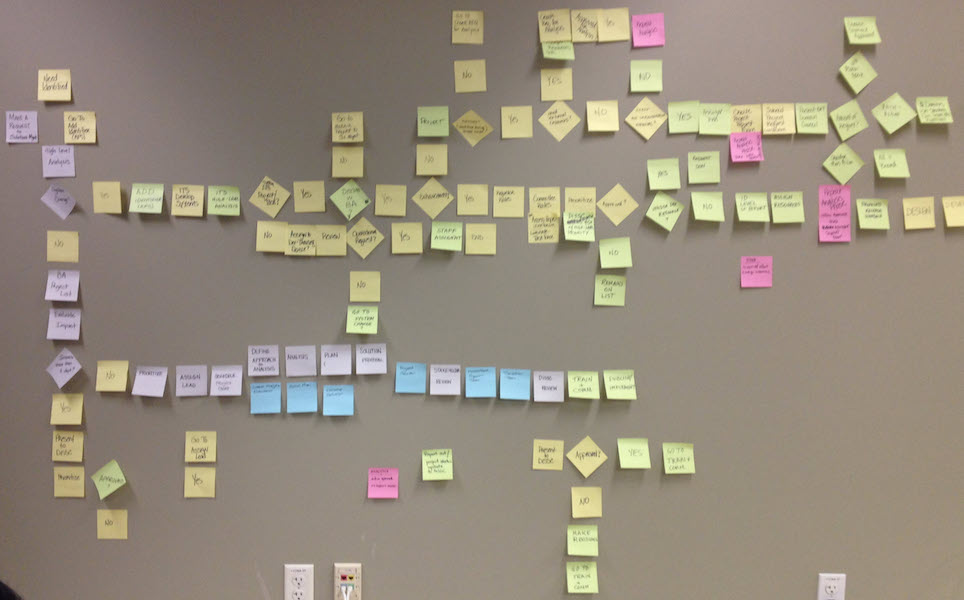
You can use different colored sticky notes for the different “lanes” of a swimlane map, if needed, and use contrasting colors (pink, for example) for pain points.
Just be sure to hold off drawing connectors and arrows until you’ve verified that your map is correct (unless you’re using a whiteboard where it’s easily erasable).
Otherwise you will have to spend time erasing and rewriting your business process map unnecessarily every time you work it.
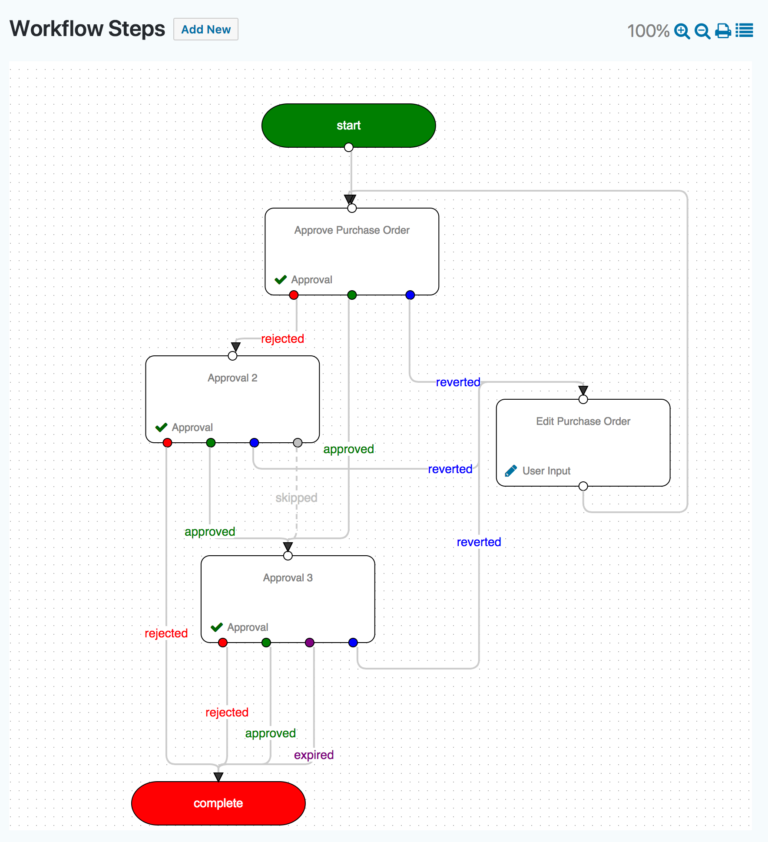
Once your physical map is created, you will want to input it into a digital format using a tool like Visio, Excel or PowerPoint.
If you’re a Gravity Flow user, you can take advantage of our Flowchart Extension, which allows you to switch between a list step and a visualization of the steps as a working flowchart.
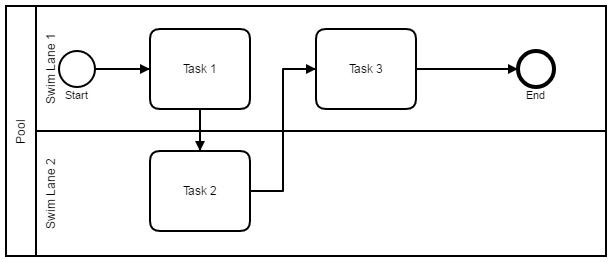
4. Use Swimlanes to Show Responsibilities
For most processes, we often recommend using swimlane diagrams.
Swimlane diagrams have the ability to simplify complex workflows as well as visualize how different departments, persons and roles work together to achieve an outcome.
Traditional business process mapping techniques are never truly ideal when it comes to showing multiple responsibilities among different parties, especially when one of them plays a leadership role.
On a swimlane diagram, a cross-team activity can be indicated by a task that extends across several swimlanes.
Here’s an example:
Without showcasing responsibilities, it can be hard to spot whether a bottleneck in the current process is coming from a specific step or a person or team.
You want to know whether or not a specific role or sub-process is limiting your productivity or if the process as a whole just isn’t working.
You don’t want to throw out a good process simply because you failed to recognized that the wrong person had the wrong job.
5. Get Input From Your Team
Finally, and perhaps most importantly, you don’t want to create workflow process maps by yourself.
They should always be created in conjunction with your team (leadership team, etc.) using input from those who are involved in a given process.
If one of your workflows goes through HR, for instance, and you’re mapping it to assess whether it’s efficient, you’ll want to interview someone from HR to ensure that they are doing the right work at the right pace.
If they say, “We never have time to upload these files,” the solution might be to add automation to the workflow to save time.
But if the bottleneck comes as a result of the software rather than a deficiency from team member or employees, then it might be time to upgrade your software or add/eliminate steps from your workflow.
You won’t necessarily recognize these bottlenecks without talking to the members involved. That’s why it’s important to get feedback from your team when mapping your processes.
Final Thoughts
Workflow process mapping can sometimes be a long process, so it’s important to know how to save the most time and energy.
To start, you want to ensure that you’re not mapping every single process unnecessarily. Focus on the ones that are prone to bottlenecks or that show signs of inefficiency.
Next, ask, “What type of process is this and can it be mapped?”
Not every workflow will be able to use a swimlane diagram. Some processes are of a higher level and require a different approach.
For those that can be mapped, start with something simple, like sticky notes and wall. Map out each step and look for areas where there are potential inefficiencies (don’t add arrows until you know your map is correct!).
Use swimlanes to show areas of different responsibility so you can see if there are human bottlenecks in your workflows.
And finally, ask for feedback. Make sure your maps are as accurate to real life as possible so you know which strategy will most improve it.
