
Business processes require continuous improvement, and organizations often need ways to improve those processes and minimize inefficiencies that prevent them from performing at their best.
One of the best ways to do this is by creating flowcharts of your business processes that simplify the understanding of business activities, define roles and responsibilities within those processes, and help identify bottlenecks that keep things from running efficiently.
But not all flowcharts are the same, nor should they be used for the same types of process.
While there are several variations of flowcharts that you can use to define a process, there are a few that stand out to help visualize workflow and to better engage in management strategies.
In this post, we’ll look at the different kinds of flowcharts and workflow diagrams you can use to improve your business processes, and how Gravity Flow allows you to harness the full power of flowcharts when creating your own powerful process automations.
Getting to Grips with Workflow Diagrams: Basic Flowcharts
Flowcharts are one subset of workflow diagrams, which in themselves are a part of the world of Business Process Modeling (or Business Process Mapping, if you prefer). This is a way of creating visual representations to give a graphic overview of business processes. Borne out of a recognition at the American National Standards Institute (ANSI) that business processes and automation had become too complex to simply visualize mentally, flowcharts were designed to bring a more scientific management approach to business and allow the graphic visualization of the different steps involved in any given process.
Different types of workflow diagrams can also help you discover potential problem areas in your business processes and to clarify more complex operations by showing a high-level overview of the tasks involved.
Most organizations that develop workflows for business processes will create a workflow diagram of some kind, whether on the back of a piece of paper or using more complex diagram drawing tools or other systems.
Before designing a workflow diagram, it’s essential that organizations start with a basic workflow analysis, which can help clarify steps in the process and expose any potential weaknesses that may delay the workflow (DocuVantage has a helpful resource for doing that here).
You’re probably familiar with a typical flowchart:
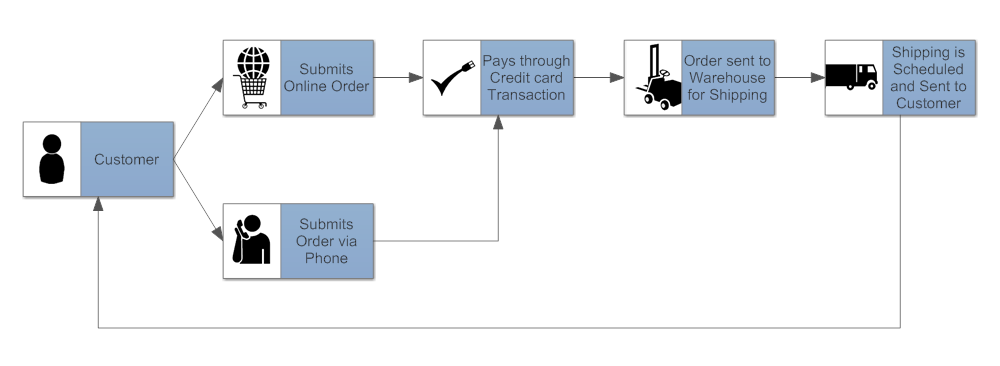
They typically use standardized symbols and shapes (in formats such as BPMN or UML Activity), showing tasks that need to be completed step by step, and can be as simple or as complex as needed. These types of flowcharts can be useful if you’re trying to track metrics for a process, improve a process by eliminating inefficiencies, or automate a manual process. They can also be useful to help employees understand their particular roles and how they relate to other departments, as well as to train new employees.
Process Flowcharts
Ramping things up a notch, we can use a slightly more complex diagram called a process flowchart. Process flowcharts are mostly used in more manufacturing, administrative or service processes but can be useful for other high-level processes as well. They’re also useful for creating data flow diagrams.
It can be used for mapping out roles and responsibilities within an organization or for drawing up a proposal for a new process, new project, or process improvement. One of the benefits of a process flowchart is that you are not limited to a single department or function. You can gain a much higher-level overview of a business process across the organization.
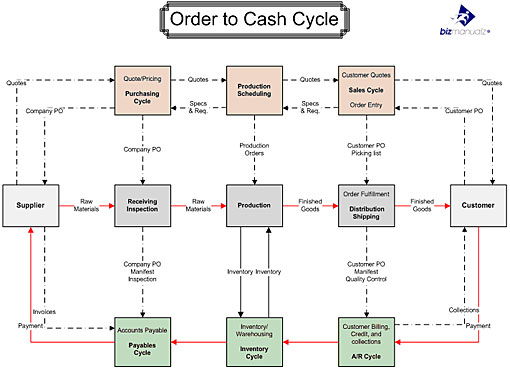
A high-level process map, like the image above, will describe the core processes in an organization and will be focused on the activity flow, sequence, and interaction of high-level processes. Often, as in the process diagram above, the connectors themselves are labeled, so that those team members unfamiliar with certain elements of the process can see at a glance what any given stakeholder is doing at a given step of the process.
They can also be used for low-level processes. The main difference between a high-level and low-level process flowchart is one of scope: A high-level process map will show the overview of the entire process throughout the organization, while a low-level process will “zoom in” on specific areas for more detail.
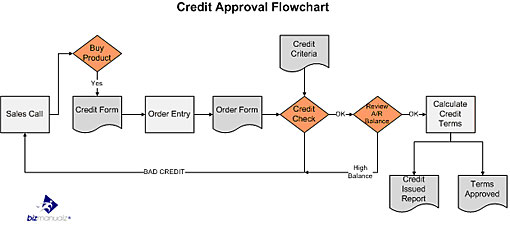
The main trouble with a low-level process flowchart is that it doesn’t always define responsibilities with the same detail as the swim lane diagrams we’ll explore below. This can result in additional visual aids such as color-coding, complicated legends, and extraneous notes, making the diagram difficult to follow. Its primary role is to define steps and connections the same way swim lane diagrams do, but swim lanes add additional dimensions that can help visualize responsibilities and constraints alongside those processes.
While you could use a more detailed low-level process map, it can be better to use a swim lane when the process involves multiple roles and responsibilities, or more detail is needed to help clarify the process.
Which brings us to…
Swim Lane Diagrams
Swim lane diagrams take the basic workflow diagram a step further. A swimlane diagram not only depicts steps in the process but also separates each unit within the organization, diagramming interaction between different departments and providing a high-level view of the flow of control in a given process, and therefore the possible inefficiencies and deviations. This makes swimlane diagrams excellent for quality management, as you can see at a glance who is responsible for a task at any stage in a process much more simply than with a typical workflow chart.
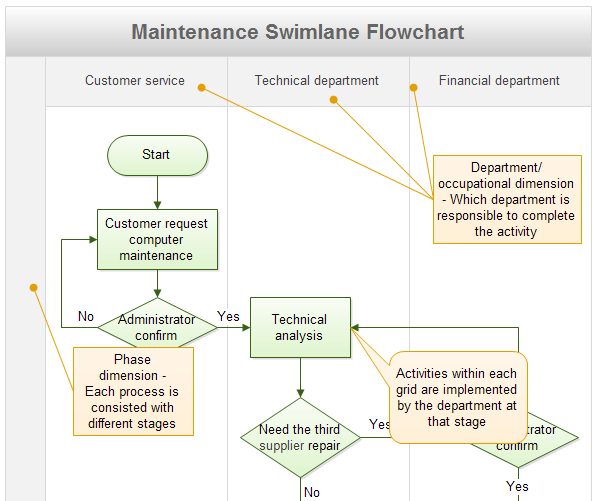
They also add areas on your flowchart (the swim lanes) to show additional components to a process, like when multiple departments or roles are involved. Swim lanes point out who is doing the work as well as what is being done.
Swim lanes point out who is doing the work as well as what is being done. Share on XThey’re also helpful in situations where timing is a factor. Swim lane diagrams are perfect for identifying time traps – which processes take the longest – as well as capacity constraints and other bottlenecks that can happen between department handoffs.
When there are activities with multiple roles, diagrams can often become complex as shapes are duplicated and placed in multiple lanes, obscuring the natural flow of the process. Swim lanes can be expanded to indicate additional areas of importance within the workflow.
You can create swimlane diagrams that are organized by role (i.e., person), by department, division, function, or some other grouping – a common term you’ll hear bandied about when referring to swimlane diagrams is SIPOC, which stands for Suppliers Inputs Processes Outputs Customers. Because each lane in the diagram represents the steps performed by one role/function/department, viewing the overall diagram makes responsibilities clear.
This can sometimes make swim lane diagrams a better choice for workflow mapping than traditional workflow diagrams, especially if there are multiple roles, departments, and responsibilities involved across the organization to complete a process.
Putting Workflows to Work
Owing to the core importance of workflow diagrams to modern business processes, there is a wealth of workflow software out there to choose from. However, there’s often an element of disconnect in implementation; while you can find lots of modeling software that will come with pretty templates and all the workflow shapes and connectors you can dream of, it’ll still be up to you to manually implement in real life any process changes you make. You’ll also need to do all the groundwork of establishing what the processes are to map, of course.
A much simpler way is to use Gravity Flow with the Flowcharts extension. Gravity Flow is the complete automation solution for form-based business processes. You can use it to automate anything requiring a form – vacation requests, purchase orders, project initiation plans, admissions, and more. Just check out our case studies to see the many innovative ways that businesses have put Gravity Flow to work for them.
The Flowchart extension expands on the core Gravity Flow functionality to incorporate a fully-fledged flowchart view that makes it easy to design, optimize, and follow complex workflows in a way that’s accessible to everyone.
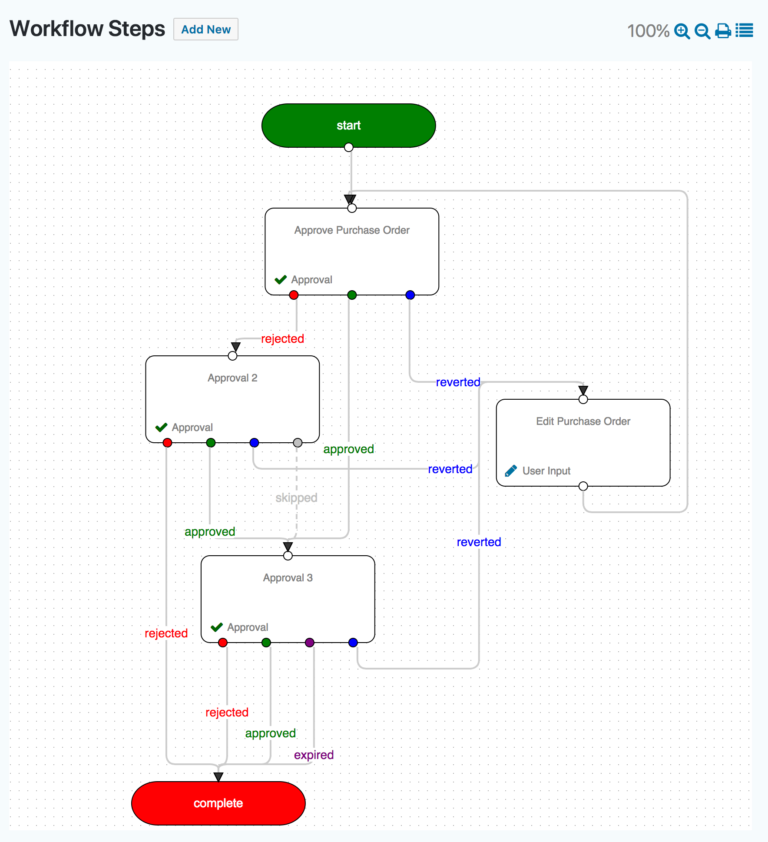
Using the Flowchart extension, you can add or remove steps to your automated forms processes in an intuitive, visual layout that will update in real-time as your process evolves. You can drag and drop boxes and connectors however you like. Once your flowchart is created, you can test it out by running through the process and make any changes as necessary to fully optimize your workflow.
Gravity Flow runs on the open-source WordPress CMS with the Gravity Forms framework, meaning that it is endlessly scalable, without costing any more depending on the scope of your process, unlike most other Business Process Management tools. In a few simple steps, you can set up a robust set of workflows directly on your website and dramatically improve your processes and efficiency.
So what are you waiting for? If you need a workflow diagram solution for your business – give Gravity Flow a try today!
Final Thoughts
In terms of which type of flowchart will work best, it’s entirely up to your needs; if you’re working in an environment where many different stakeholders have input into a given process, we often recommend using a swim lane diagram over a basic workflow diagram or a more complicated process flowchart.
Swim lane diagrams have all of the advantages of mapping out a process the way a workflow diagram does, but can expand processes to include roles and responsibilities across multiple departments and identify time traps, bottlenecks and other constraints.
If this post has inspired you to get started implementing workflow diagrams as a part of your business processes, why not get started with the most flexible custom form workflow solution out there, Gravity Flow? Trusted by businesses in over 100 countries worldwide, Gravity Flow makes process mapping, management, and reporting simple and easy to use, all within the open-source WordPress framework. For efficient and effective workflow diagrams, you can’t go wrong with Gravity Flow.
